Alerts Console
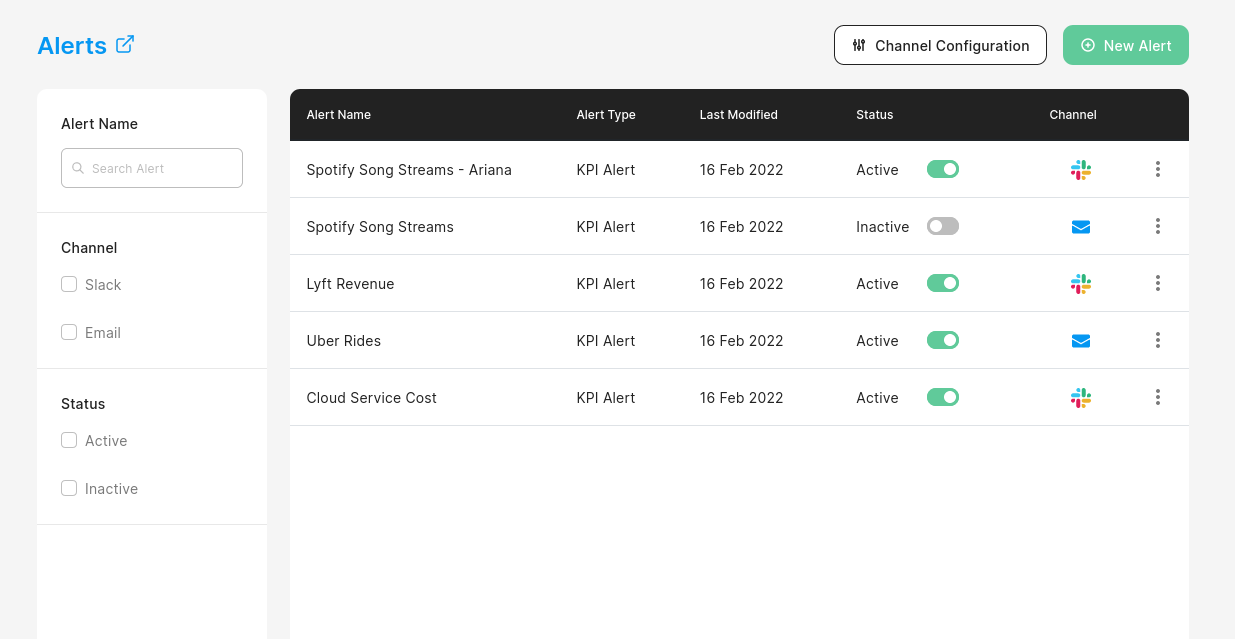
Once you've setup Alerts, while Navigating to Alerts section from the vertical navigation bar, you will be redirected to the Alerts Console. The list of all alerts you have configured so far will be found here.
In case you no longer want to receive an alert, you can disable the alert from the Alerts Console. You can also edit an alert.
Clicking on the Alerts heading at the top will redirect you to the Alerts Dashboard.
Alerts Dashboard
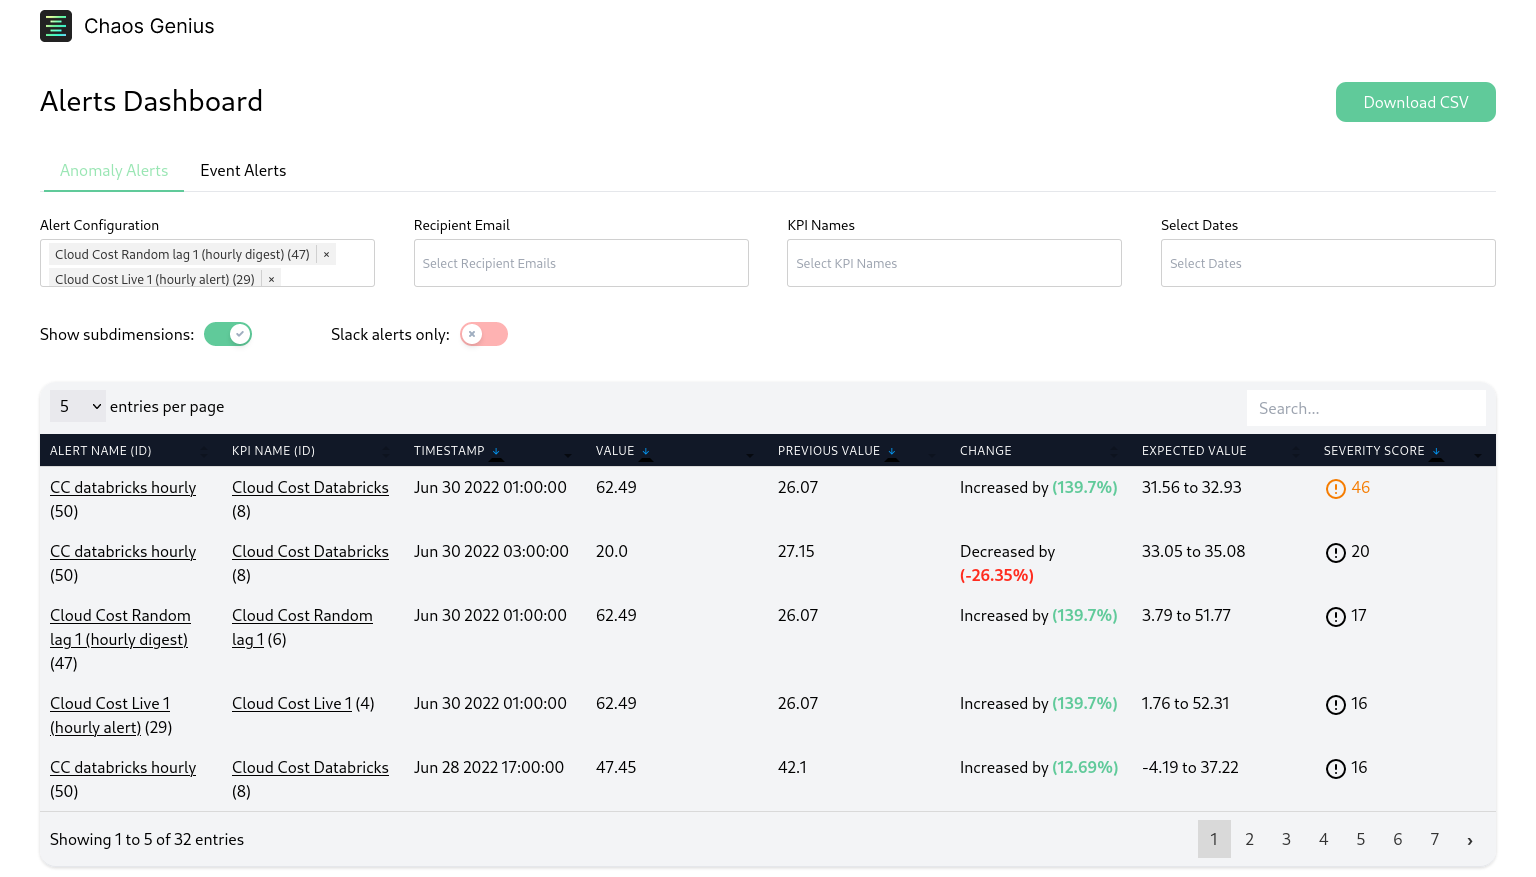
The dashboard shows all of the alerts triggered in the past week.
You can navigate to the alerts dashboard by clicking on the Alerts heading on the alerts page, or by navigating to <your-ip-or-hostname>/api/digest (for local installs, this will be http://localhost:8080/api/digest).
note
- The date and timestamp shown are of the anomaly point and not the time at which the alert was sent.
- The dashboard also includes alerts triggers that are yet to be sent in a consolidated report.
Filters
You can filter based on:
- Alert name: given while setting up alert
- Recipient email(s)
- Slack: shows only alerts which were sent through slack
- KPI name
- Date of anomaly
Sub-dimensional anomalies
By default, sub-dimensional level anomalies are hidden for brevity. You can enable them using the toggle (note that this will clear existing filters or sorting).
Sorting
You can sort the table by:
- Anomaly timestamp (default)
- Value of metric
- Previous value of metric
- Change in value
Data download
Once you have applied all the filters and sorting you need, you can download the table as a CSV using the Download CSV button in the top right corner.